

Observability Integrations
Prometheus Endpoint
Ubiq offers Enterprise customers a Prometheus endpoint that can be used to monitor availability status of Ubiq in your own observability platform powered by Prometheus. To do this:
- Navigate to the Integrations page
- Click on Prometheus under the SIEM Integrations header
- Enable the Prometheus endpoint
- You will be given a URL and a token. The token is used to securely identify your customer account to prevent Ubiq endpoints from being used by unauthorized consumers. Please keep this token and URL secure.
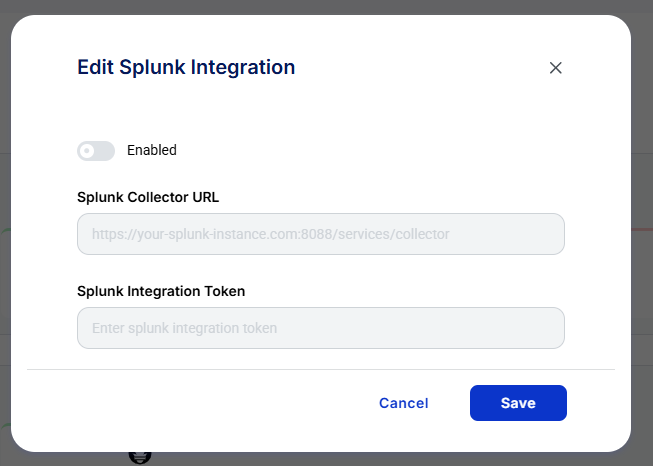
Event Streaming (SIEM Log Forwarding)
Enterprise customers can also enable Event streaming to push activity and usage events to your SIEM provider. Ubiq currently supports Splunk as a SIEM integration a Prometheus endpoint that can be used to monitor availability status of Ubiq in your own observability platform powered by Prometheus. To do this:
-
In your Splunk environment, set up a new collector and token to retrieve data from Ubiq (Splunk links for CLI or web instructions below)
-
Navigate to the Integrations page
-
Click on your SIEM provider (Splunk)
-
In the modal that pops up, enable the integration and then enter your Splunk collector URL and integration token
Updated about 1 month ago